
Understanding points
How points are earned and spent, balances, trends and sparklines. Read more
The dashboard is where you land when you open TaDone. It answers the question a parent opens the app for: how is everyone doing today? From the family Overview you can scan every member at a glance, then tap into any one of them for the full picture — points, streaks, daily missions, trophies and charts.
The Overview shows one card per selected member, each leading with what matters most: points earned, the current streak (🔥 flame and day count), a points sparkline, a task-completion bar (for example 3/5 tasks), and that member’s most recent activity.
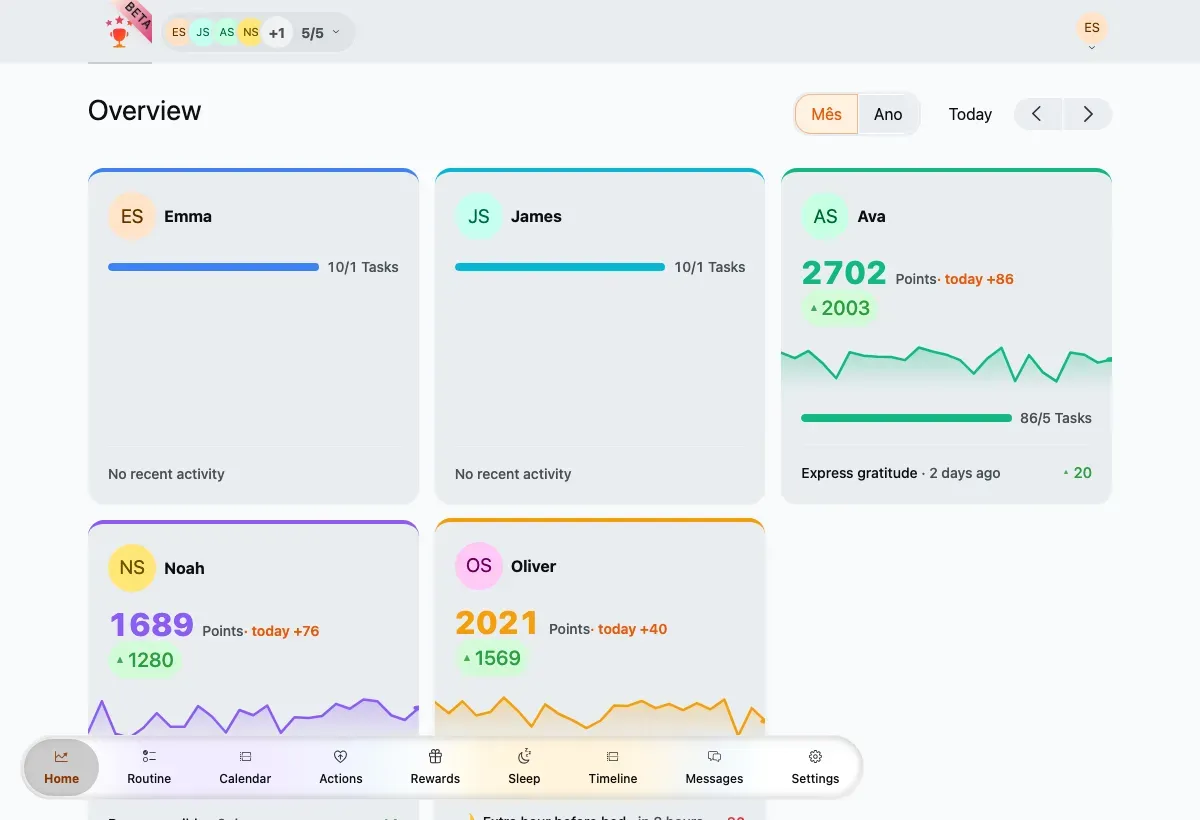
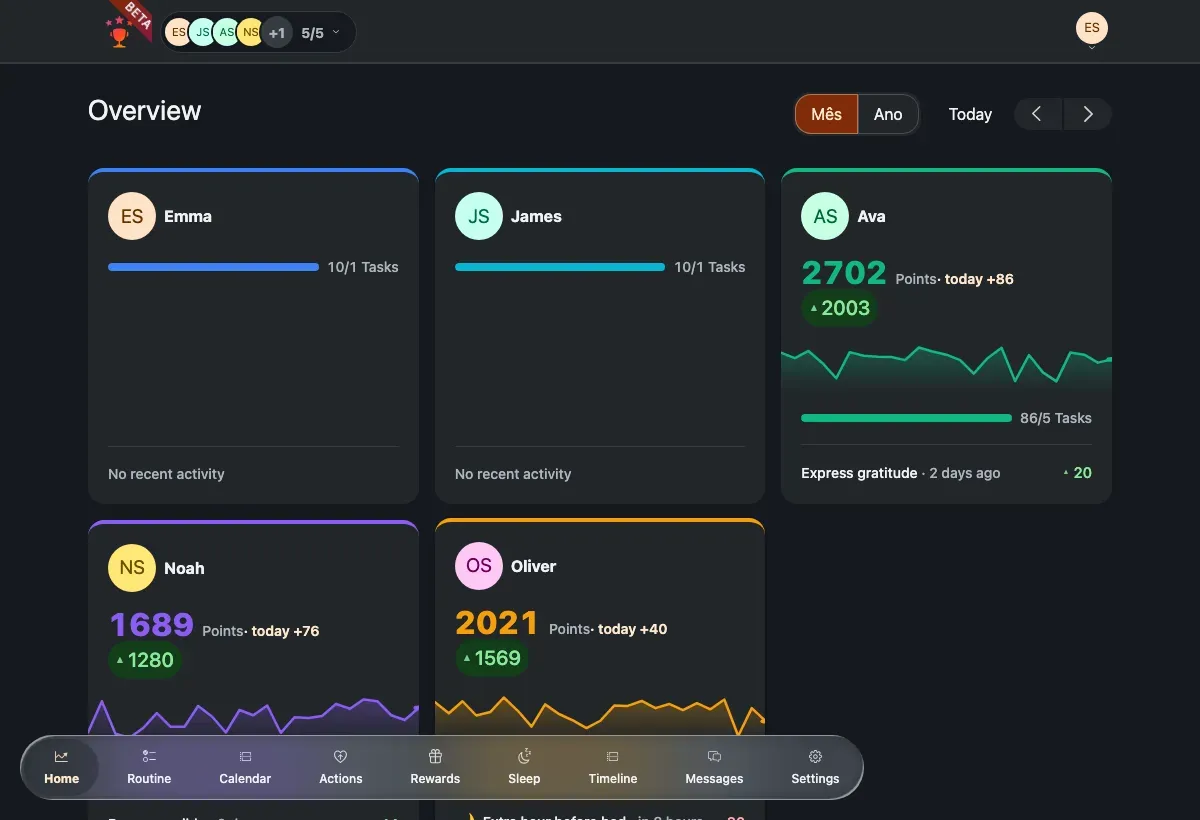
The Overview: a card per member. Tap a card to open that member’s full dashboard.
Every number on the dashboard is measured over a period you choose.
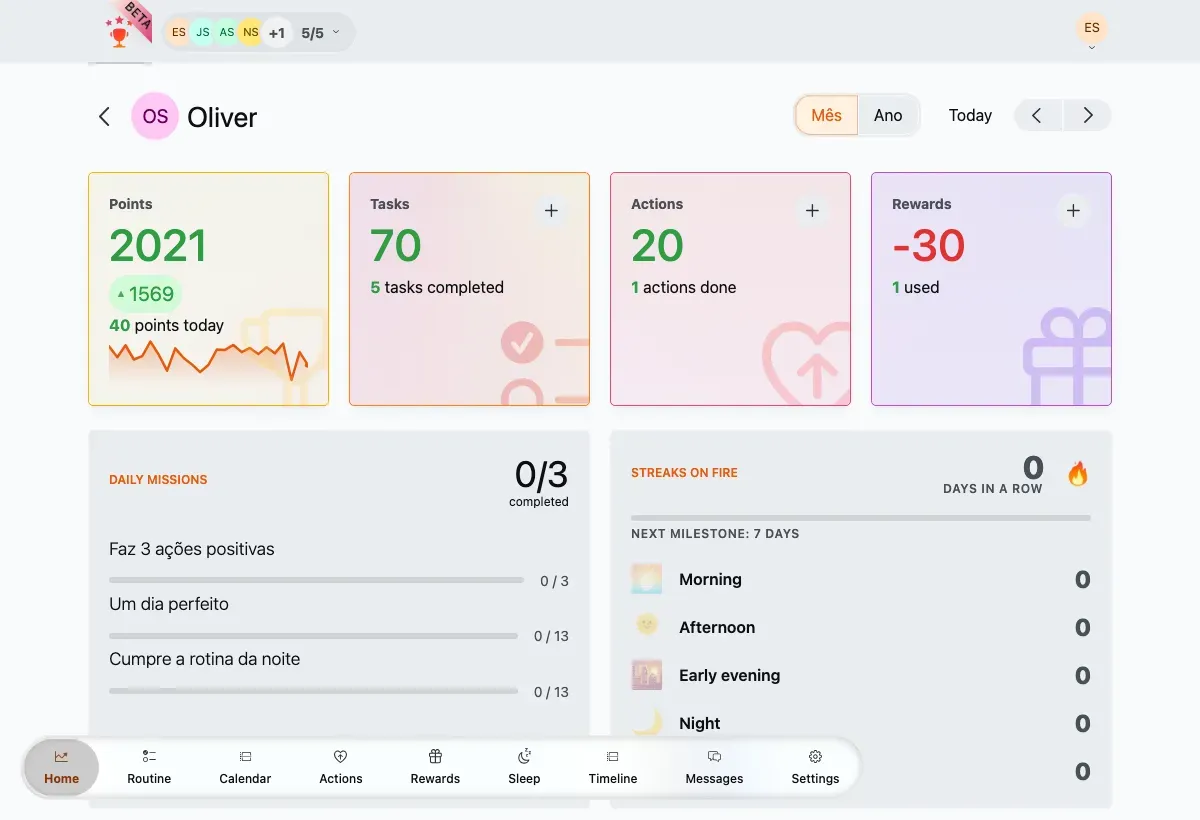
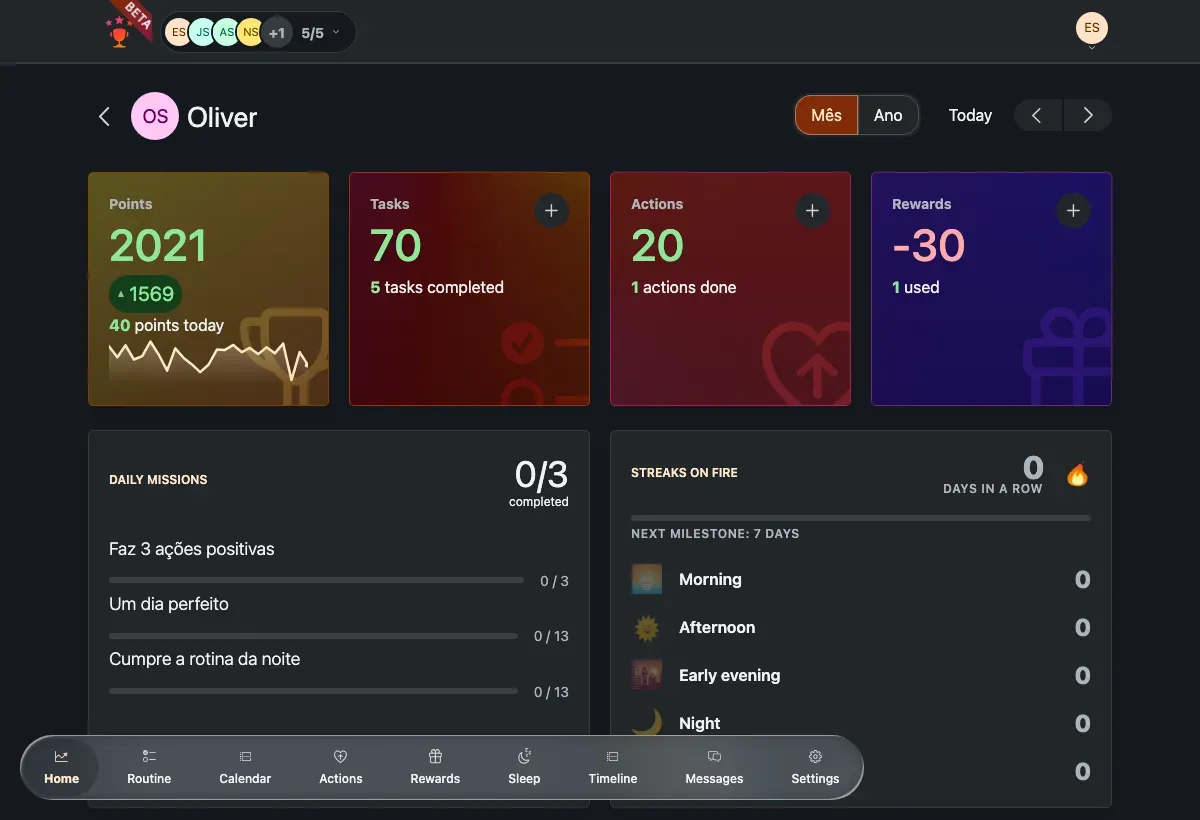
Tap any card to open the full dashboard for that member — the deep view you use to review one child. It opens with four summary tiles: Points, Tasks, Actions and Rewards, each showing the total for the current window.
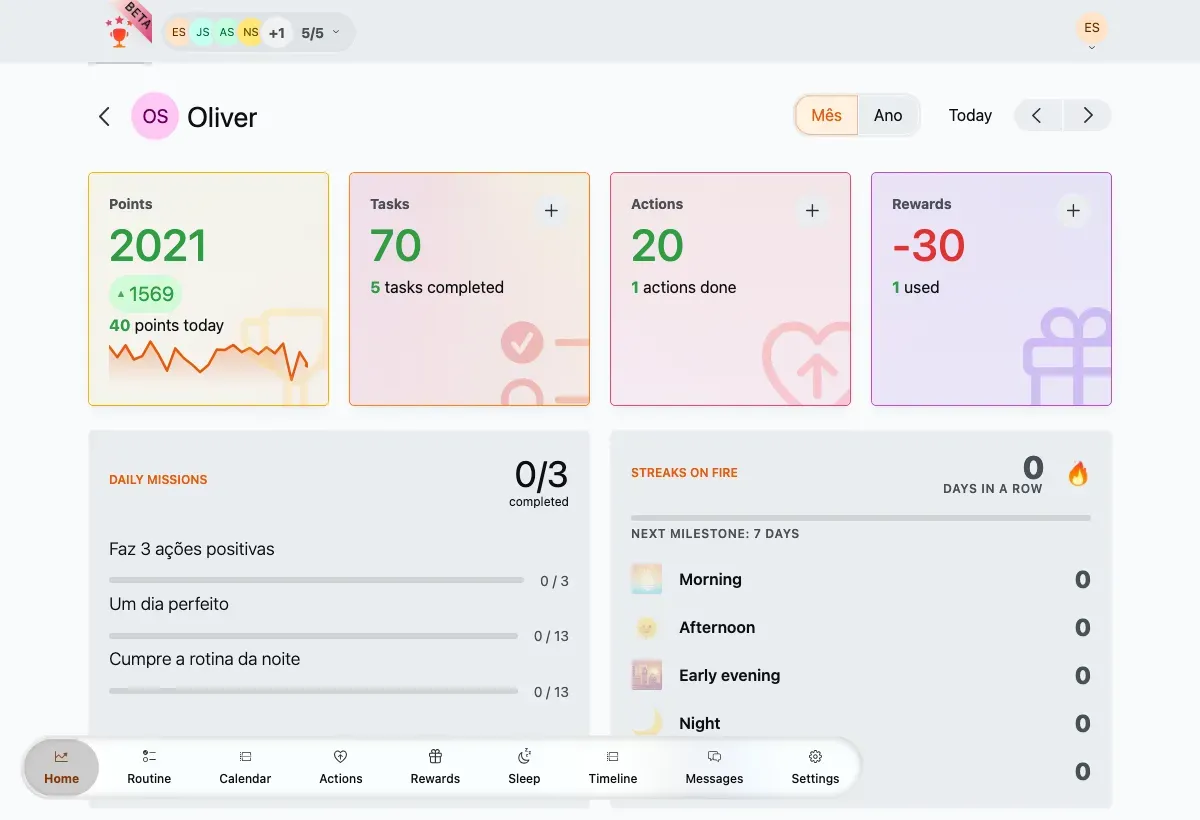
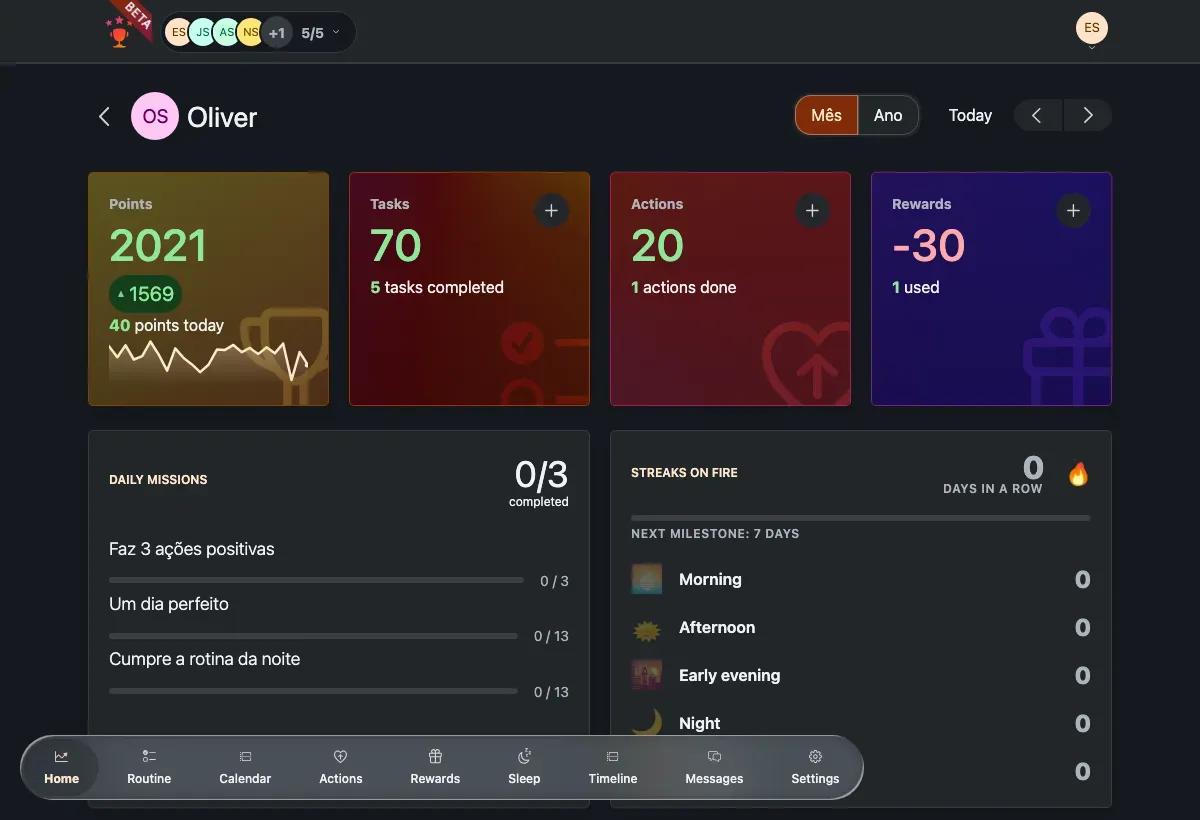
Miguel’s dashboard — summary tiles on top, with the Daily missions and Streaks panels below.
Scroll to the Statistics section for charts that plot points over time and break activity down by type across the selected window — a fuller view than the tile sparklines.
The Statistics charts for a member with history.
Understanding points
How points are earned and spent, balances, trends and sparklines. Read more
Daily missions & streaks
Short daily challenges and the streaks that reward consistency. Read more
Trophies & badges
Long-term, multi-level achievements the whole family can chase. Read more
Dynamic difficulty
Keep points meaningful by tightening the economy as a child improves. Read more
Activity history
The full, day-by-day timeline of everything your family has done. Read more